Boost klog
Speeding up my Go CLI app tenfold
I recently got curious about the performance characteristics of klog (my CLI tool for time tracking), especially when evaluating larger amounts of data. So far, I didn’t bother too much about the speed of the Go implementation, at least not in the sense that I actively measured and optimised for execution performance. The CLI tool feels really snappy in typical day-to-day scenarios, so there was no apparent need to put special effort into this topic.
In order to see where things are, I generated a test file with a few centuries worth of time tracking data, resulting in a file size of 100 MB.1 (You know, just to be safe.) For the benchmark, I measured how long it would take for klog to parse that file, to sum up the accumulated duration of all time tracking entries, and to return the computed total time. I kicked it off and waited. And waited. Birds twittered. I waited. Clouds passed by. Still nothing. A train whistled somewhere far away. Nada, 何もない, nüscht. Then, finally, the result showed up. It had taken a whopping 23 seconds.
Of course, such an amount of test data is ridiculously unrealistic. Usually, people have one file per month, or maybe one per year, with file sizes typically ranging in the low KBs at most. Hence, a benchmark based on a 100 MB data set is light years away from any remotely reasonable use-case. So why bother about it? I had other things to do, things that actually mattered, so I left it at that and moved on. But deep down inside me, a warning voice tried to appeal to my honour, telling me that I shouldn’t just ignore these terrible benchmark results, or it would come back to haunt me. I brushed it off.
That evening, it took me a long time to come to rest. When I eventually fell asleep, I found myself in the ambiance of an ancient clockmaker’s shop. The walls and shelves were covered with myriads of different clocks and watches from all epochs. No one else seemed to be there – it was just me and the clocks, and all of them were ticking in unison. Tick, tock. Tick, tock. Tick, tock.
I walked around and inspected the room, wondering what this situation was all about. Why was I here? Who ran this shop? And where the hell was the clockmaker? I noticed that the ticking became louder and faster. Slowly but steadily, cadence and volume were raising. What started out as soft, monotonous clicking had turned into an intense drumbeat already – and continued to amplify merciless, tick by tick.
In a twinge of panic I looked for an exit. But I couldn’t find one. There were just walls and shelves and clocks to all sides, and by now, the whole house was shaking due to the ear-shattering inferno that had unfolded. I covered my ears with my hands, and yet, the noise was unbearable. My head felt like it would explode any second, so I started to scream out of sheer desperation. STOOOOOOOOOOOP!!!
All of a sudden, there was dead silence.
From one moment to the other, the clockworks had frozen abruptly. I hesitantly took my hands off my ears. The noise had stopped, and with it, the whole universe seemed to have come to a halt. It felt almost unreal, like a world in between, beyond space and time. Besides the silence, there was an eerie tension in the air. Was I still alone in the room? My thoughts rushed, but I didn’t dare to move.
Time stood still for an endless moment, as the sudden sense of a breath on my neck made my blood run cold. Petrified with horror, I realised that someone was standing right behind me. I did my best to compose myself, and – ever so slowly – turned around. Within arm’s reach, I faced a giant, haggard figure, cloaked in black from head to toe. From underneath a giant hood, two piercing eyes were staring straight at me. The writing was on the wall. This was it. The klogmaker had come after me.
I woke with a start. Trembling, and bathed in sweat, it took me a while to recognise where I am. Fortunately, it was all just a bad dream. The message, however, was beyond question. It was a warning, loud and clear, and it only allowed for one logical conclusion. I hastily jumped out of bed, rushed over to my computer, and started to code like there was no tomorrow. MUST. IMPROVE. PERFORMANCE.
Fast forward to today, after days of frantic programming, with barely any sleep at all, and a coffee consumption like the fuel intake of a fully occupied airplane during take-off, I’m finally done. I probably better spare you the emotional details of what I went through, as that might be both disgraceful and deeply disturbing. My blurry memories also wouldn’t really matter. In the end, all what counts is the cruel and unadorned truth of the bare numbers: it’s 2 seconds.
So much for the preamble. Let’s dive into it.
Speeding up the code
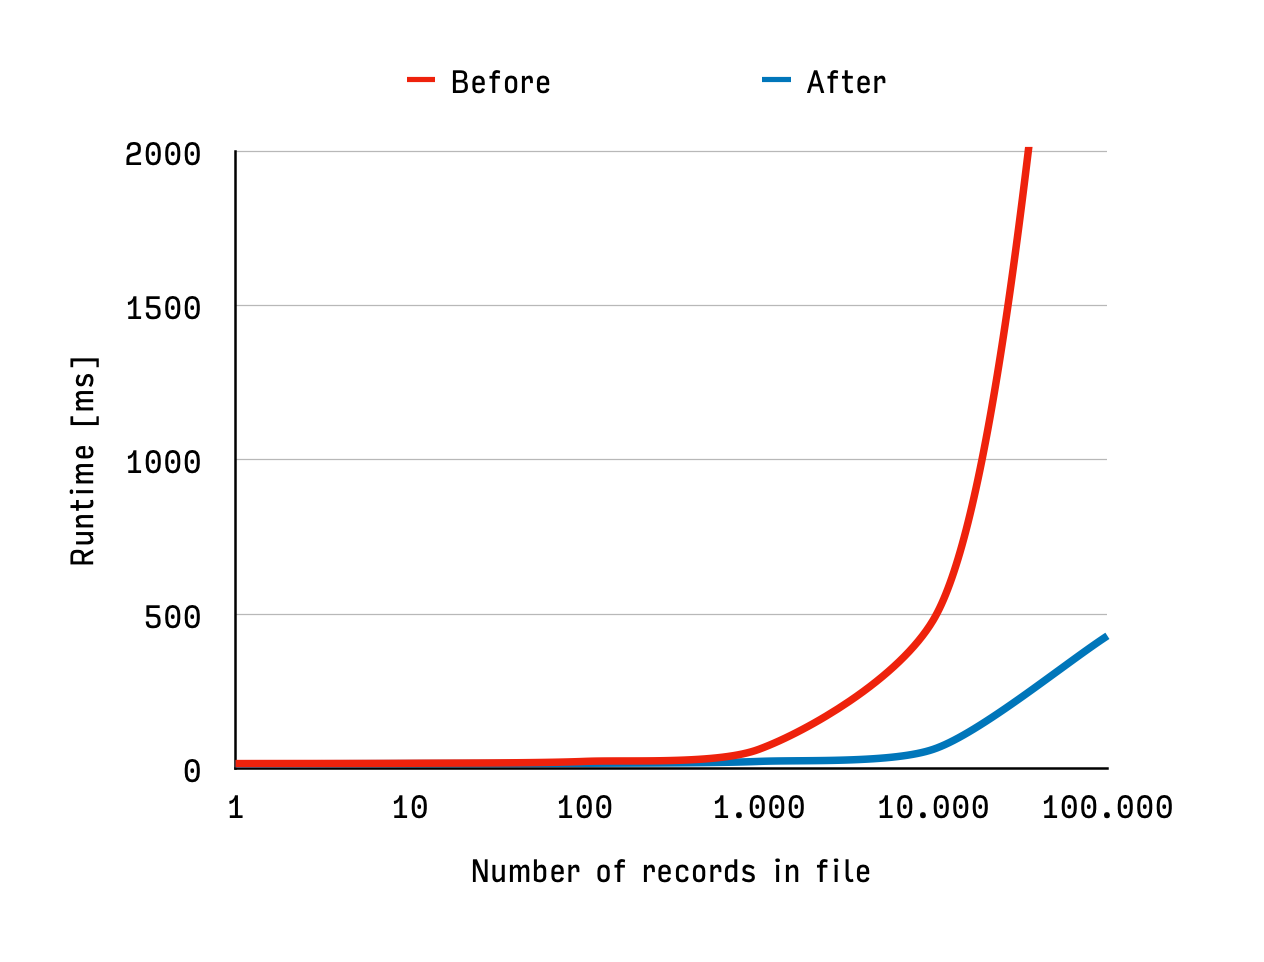
The data below is the benchmark comparison between before and after all performance optimisations. In the chart, the x-axis is logarithmic and shows the number of records in the file. The y-axis shows the runtime of the klog total command (which parses the data and evaluates the accumulated duration of all time entries). Note: my 100 MB test data set consisted of 500.000 records – I had to cut off the chart, though, for better resolution in the lower range.
| 1 | 10 | 100 | 1.000 | 10.000 | 100.000 | 1.000.000 | |
|---|---|---|---|---|---|---|---|
| Before [ms] | 16 | 17 | 22 | 62 | 460 | 4.300 | 43.500 |
| After [ms] | 15 | 16 | 17 | 23 | 61 | 435 | 4.500 |
As you can see, both versions are quite similar at the lower end of the range, so below 100 records there is almost no difference. From the low 3-digits on, though, you can roughly say that the optimised implementation scales 10 times as good as the previous version.
Some context, by the way, about the benchmark numbers that I cite throughout this blog post. They are based on the following setup:
- The generated test data aims to represent a diverse and realistic variety of use-cases, e.g. in regards to how many time entries a record contains,2 or how much summary text is associated with them.
- I ran the benchmarks on a MacBook Pro with Intel quad-core CPU.
So even though the results are specific to that particular setup, they should give a good indication of the overall trend. The optimisations that I looked into can be roughly divided into three aspects, which I elaborate on in the following three sections.
#1. A quick-win as opening
After having set up the benchmark, my first stop was the CPU profiler, in order to inspect what was going on in klog’s main parsing function. You see a screenshot of it below. Can you spot any obvious problem here?
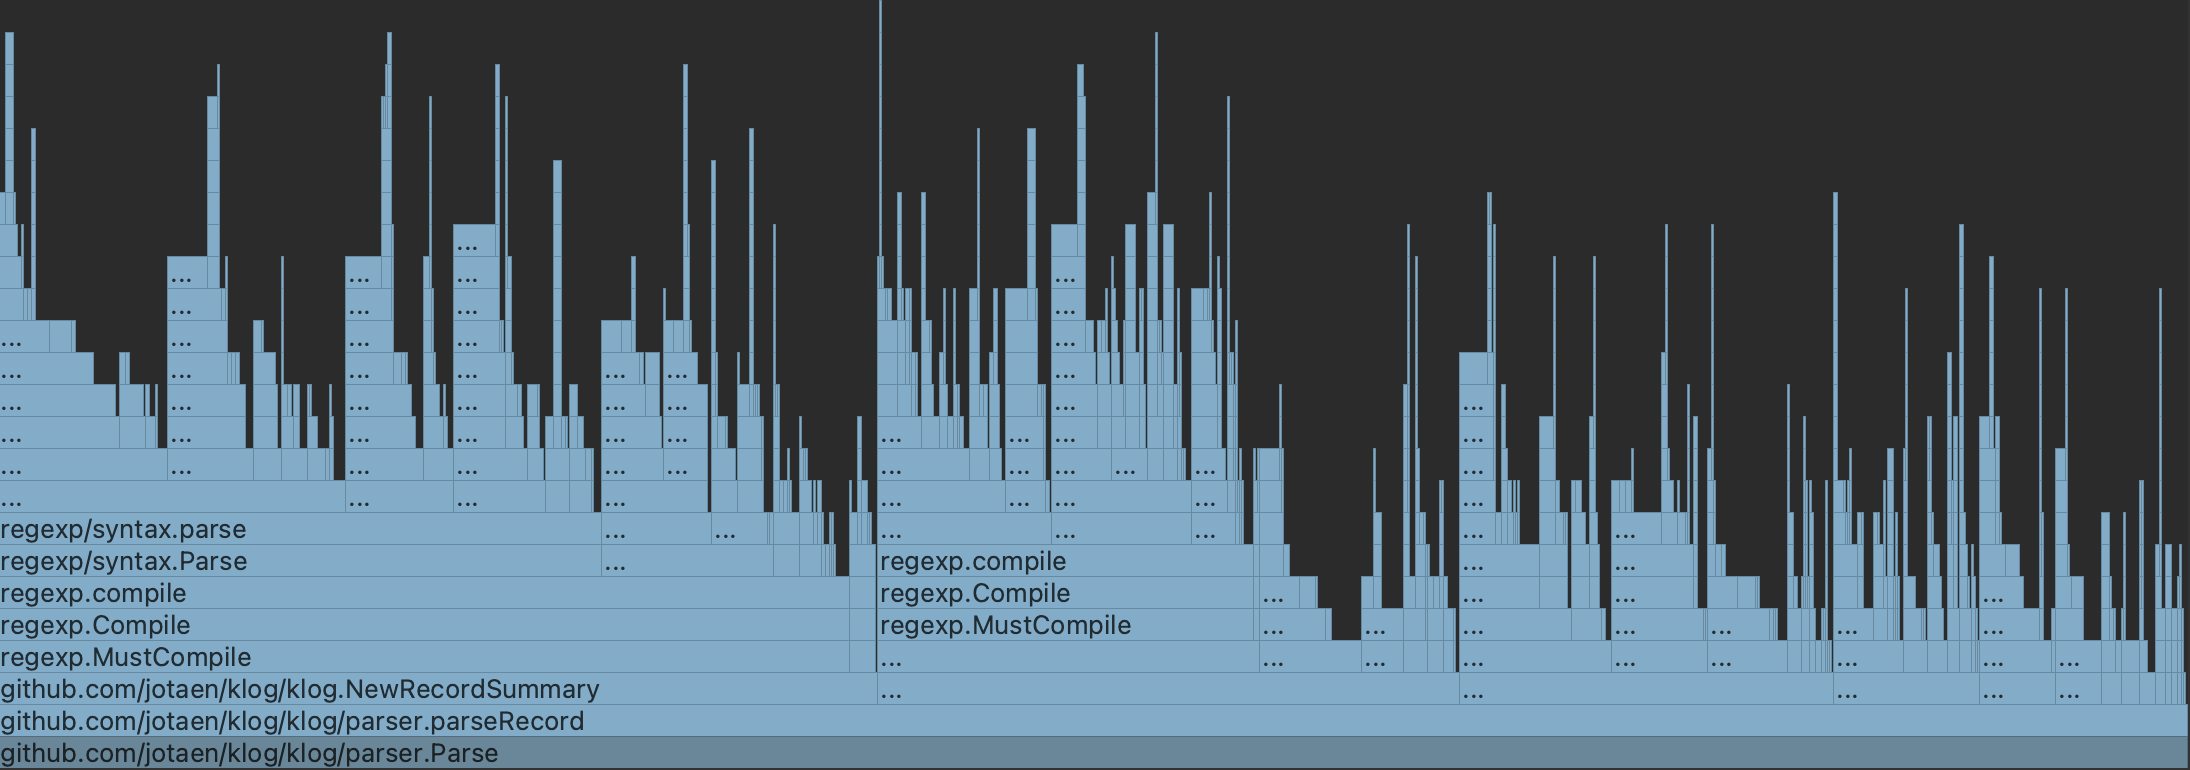
It’s probably not too hard to find – most of the method names are truncated, which is due to two of them making all others squeeze together: regexp.MustCompile. What you basically see here is how klog’s parsing method effectively spends half of its time compiling the same two regular expressions over and over again.
The reason for that is quite simple: I had just forgotten to store these two regexes as global constants, so their instantiation was accidentally inlined into the method body. Hence, they were re-created on every single invocation. (A few million times in this case.)
The fix was as quick as it was effective: 2 lines of code, in exchange for cutting the parsing latency almost in half, namely from 23 seconds down to 15 seconds. That’s what I call a great deal. A promising prelude to a fruitful optimisation journey – and a slightly embarrassing one at the same time. But well, we all make mistakes, don’t we?
#2. Parallel parsing: the tricky bit
The majority of the overall runtime of the klog total command is spend with parsing the plain text into rich data objects. This means that all other operational concerns such as reading the file from disk or summing up the resulting total time are comparatively quick.
The klog parser processes the input data sequentially, one character after the other. Coding-wise, that’s the most simple approach. But it also means that one single core of the CPU gets to do all the work, while the others are twiddling their thumbs. If the parsing work could be done in parallel, then this would divide and hence speed up the overall parsing latency by the number of available CPU cores.
The following image illustrates how the input data would flow through a parallel parser with 4 CPU cores:
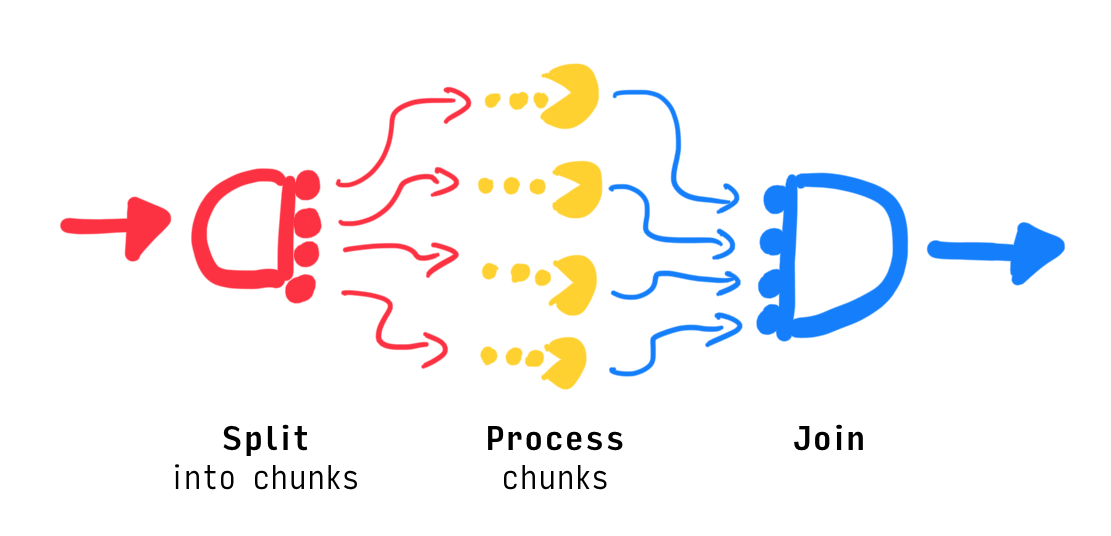
We first need to split up the input text into 4 chunks, then pass them on to the individual chunk parsers, and finally wait for all results, so that we can join the chunk results in the correct order. From then on, the rest of the program is the same as before.
From an algorithmic perspective, this data flow creates a catch-22 situation, though: in order to divide the workload evenly between CPU cores, we have to split the input data. But before having processed the data, we don’t know where to safely split it.
In order to understand this problem (and the solution) better, let’s look at a simplified example. Imagine we had the following text, which we wanted to parse to retrieve a list of words:
It was a bright cold day in April, and the clocks were striking thirteen. 3
The signature of our parsing function would map from “text” to “list of words” – think:
func (inputText string) []string
The implementation of that parsing function would have to go through the text character-wise, in order to look for word boundaries (i.e., space characters or end-of-text), and continuously accumulate the words in a result list.
A naive approach to splitting would be to just chop up the sentence into 4 chunks, and have 4 workers simultaneously process these chunks. That way, each worker could e.g. get to process the following character sequences:
1 →  It was a bright cold
2 →   day in April, and t
3 →  he clocks were strik
4 →  ing thirteen.
While the original sentence contains 14 words in reality, the above split would yield 16 words (5+5+4+2), 4 of which incorrect (the ones that were broken up in between, namely). The problem is actually worse, because with UTF-8 encoding, one character isn’t equal to one byte, but a single character might rather consist of a sequence of multiple consecutive bytes. So by splitting the input text on byte-level, we not just get cut-up words, but we might even accidentally botch up individual characters.
So how about pre-parsing the text and converting the bytes into a UTF-8 character stream? While that would technically do, we’d effectively end up with a serial parsing step preceding the parallel one. That, however, foils our parallelisation efforts and creates an undesirable bottleneck.
Fortunately, there is a solution that scales better. For that, we have to look at how a UTF-8 string is represented on bit-level – for example, this is how the German word “Größe” (height) looks in memory:
G → 01000111
r → 01110010
ö → 11000011 10110110
ß → 11000011 10011111
e → 01100101
As you notice, the characters G, r, and e consist of one byte each, and their bit patterns all start with a 0 bit. In contrast, the characters ö and ß have two bytes each, and their first byte starts with a 1 bit. That’s not at all a coincidence: in UTF-8, the first byte of a multi-byte sequence always starts with a 1 bit, followed by as many 1 bits as there are consecutive bytes, concluded by a 0 bit. The consecutive bytes all start with the bit pattern 10.
That means, we are able to split up our input text safely if we inspect the outermost byte of our chunk, and check whether it belongs to a multi-byte sequence. If so, we have to step forward and enlarge our chunk by a few bytes,4 until we encounter the start of the next UTF-8 character. That way we can make sure that the encoding within each chunk stays intact.
We can effectively apply the same approach to fix the problem with the cut-up words, i.e. making sure that we don’t split within a word. Similar to above, when performing the chunk split, we keep stepping forward character-wise until we encounter a space character. That way, it’s guaranteed that each chunk will always contain complete words, which allows the worker to process the chunk conclusively.
(That also implies, by the way, that the chunks are probably not evenly sized. This is irrelevant for us, though, since for long input texts, the size variance of the chunks is relatively tiny in comparison to the respective chunk size.)
Now, if we come back to parsing .klg files, the klog file format allows us to adopt the very same principle: a .klg file contains a number of records, where every record consists of multiple consecutive lines, and where there is a blank line between the records. When splitting up chunks, we therefore look for blank lines5 (instead of word boundaries), and can thus be sure that a chunk always contains complete records.
So much for the principle. The implementation needs to account for a few smaller edge-cases, but is otherwise surprisingly straightforward. On my machine, I can clearly see how CPU utilization peaks at >95% across all 4 cores, in comparison to 20%–25% for serial parsing. The overall runtime was reduced from 15 seconds (from the previous step) to 6 seconds.
In theory, parallel parsing comes at a small latency cost for the overhead required to facilitate the parallelisation. That’s at most noticeable on small data sets, however, and in case of klog, it’s completely negligible. An obvious performance gain starts to kick in at a low 3-digit count of records. Its effect then corresponds directly to the number of available cores.
#3. Memory mumblings
From a performance-perspective, memory management is an important topic for two main reasons:
- Dynamic allocations:6 these are rather expensive, because the application has to request memory from the operating system on-demand. If this happens repetitively, e.g. when growing an array or a string from within a loop, the latencies can add up significantly.
- Garbage collection: the garbage collector freezes the program every once in a while, to collect and dispose unused objects from memory, which adds latency each time. The rules and intricacies around that are quite complex, however.
Regarding the first aspect (allocations), I was able to identify numerous functions and improve their memory characteristics. For example, for some functions that assemble a list internally, I realized that I was able to restructure the code in order to determine the eventual size of the list ahead of time. That way I could avoid to grow the list iteratively, and hence prevent repeated allocations. All in all, the miscellaneous allocation-related optimisations brought down the benchmark runtime from 6 seconds (from the previous step) to 2 seconds.
The second aspect (garbage collection) didn’t turn out to be that successful, unfortunately. Despite the fact that garbage collection still takes a heavy toll in the overall runtime, I couldn’t identify any obvious “quick-wins”, so digging into this further would have been pretty laborious. Considering that the benchmark result was already looking quite good, the remaining absolute performance gains also would have been rather marginal.
If I wanted to come back to this topic, I’m also not sure whether it would make sense to invest into optimising the current implementation in regards to garbage collection. klog currently heaves the entire file into the RAM, and then processes all data in one go. While this is very convenient from a coding perspective, it results in a substantial memory demand for larger input files: currently, the memory footprint is roughly 10 times the file size, so 100 MB data consume more than 1 GB of RAM throughout the runtime.
For the benchmarks, I made sure that enough memory was available – if memory is constrained, however, this behaviour would pose a lot more work on the garbage collector and thus create a substantial and erratic performance penalty. (In the worst case, the process would run out of memory and crash.)
So I think instead of optimising the current code further, it might have more impact to convert all of klog’s internal APIs from lists to streams, to achieve a continuous data flow within the application. That would reduce the memory demand significantly, and thus take a lot of pressure from the garbage collector.
I’m not sure this is really worth it, though, because such a refactoring requires code changes in almost every file, so it has extensive ramifications. And it’s not just about the effort: as addicting as performance optimisations might be, at some point they start to compete against code simplicity and readability. And that’s something I’m not willing to sacrifice, because it eventually harms maintainability, which I see more value in here.
Conclusion
I suppose the numbers speak for themselves, so let’s make this short: I’m more than happy with the result, and the klogmaker daemon seems to be appeased as well. At least he didn’t nag me anymore, so there is that.
-
Please see the klog docs to learn what the file format looks like. ↩︎
-
In klog, a “record” is equivalent to one calendar day, which can contain multiple time entries. ↩︎
-
Courtesy of George Orwell (1984) ↩︎
-
In UTF-8, multi-byte sequences can be up to four bytes in length. ↩︎
-
A “blank line” is a line that is either empty or only contains whitespace characters. ↩︎
-
By “dynamic allocations” I mean memory allocations on the heap; think
mallocin C. ↩︎